Note
Go to the end to download the full example code.
Maxtree example
This example shows how to use the component trees with Pylena
import matplotlib.pyplot as plt
from skimage.data import camera
import pylena as pln
import pandas as pd
import numpy as np

img = camera()
Compute the max-tree and the area of component and a custom attribute
maxtree = pln.morpho.maxtree(img, 4)
area = maxtree.compute_area()


mass_centers = maxtree.compute_attribute(lambda init, p: (init[0] + p[0], init[1] + p[1]), (0, 0))
mass_centers = np.array(list(mass_centers), ndmin=2)

df = pd.DataFrame(
    {
        "parent": maxtree.parent,
        "gray": maxtree.values,
        "area": area,
        "mc_x": mass_centers[:, 0] / area,
        "mc_y": mass_centers[:, 1] / area,
    }
)

df
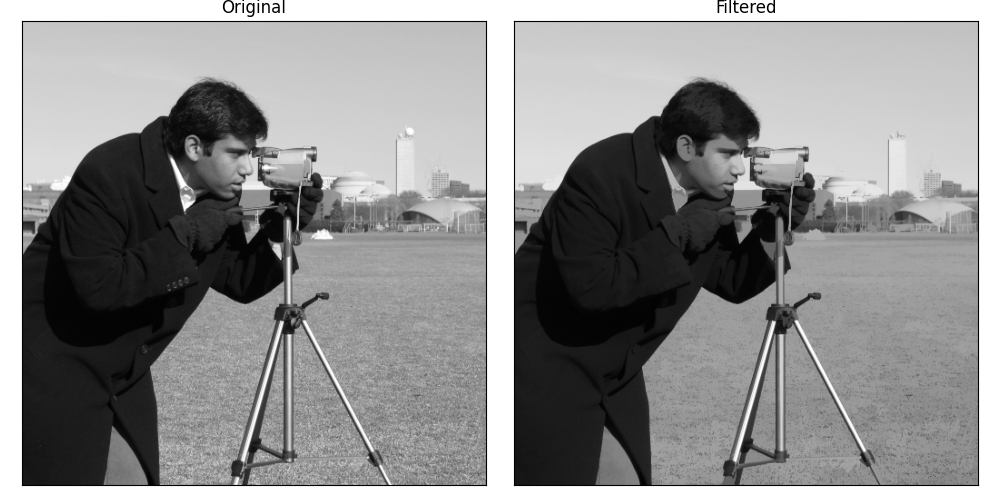
Filtering and reconstruction
maxtree.filter((df["area"] > 200).values, inplace=True)
filtered = maxtree.reconstruct()

fig, axes = plt.subplots(nrows=1, ncols=2, figsize=(10, 5))
axes[0].imshow(img, cmap="gray")
axes[1].imshow(filtered, cmap="gray")
axes[0].set_title("Original")
axes[1].set_title("Filtered")
for i in range(2):
    axes[i].set_xticks([])
    axes[i].set_yticks([])
plt.tight_layout()

plt.show()
Total running time of the script: (0 minutes 1.440 seconds)