Note
Go to the end to download the full example code.
Watershed Segmentation Example
This example shows how to use the watershed on an image to make a segmentation.
The watershed segmentation is based on the usage of an image as a landscape, where each minimum is a basin of a lake. It simulates the filling of these basins and where two basins meet, it make a watershed line.
Meyer’s watershed from local minima
First, we import the modules needed to use it
from pylena import morpho
from skimage.data import camera
import matplotlib.pyplot as plt
import numpy as np
We first get an image
img = camera()
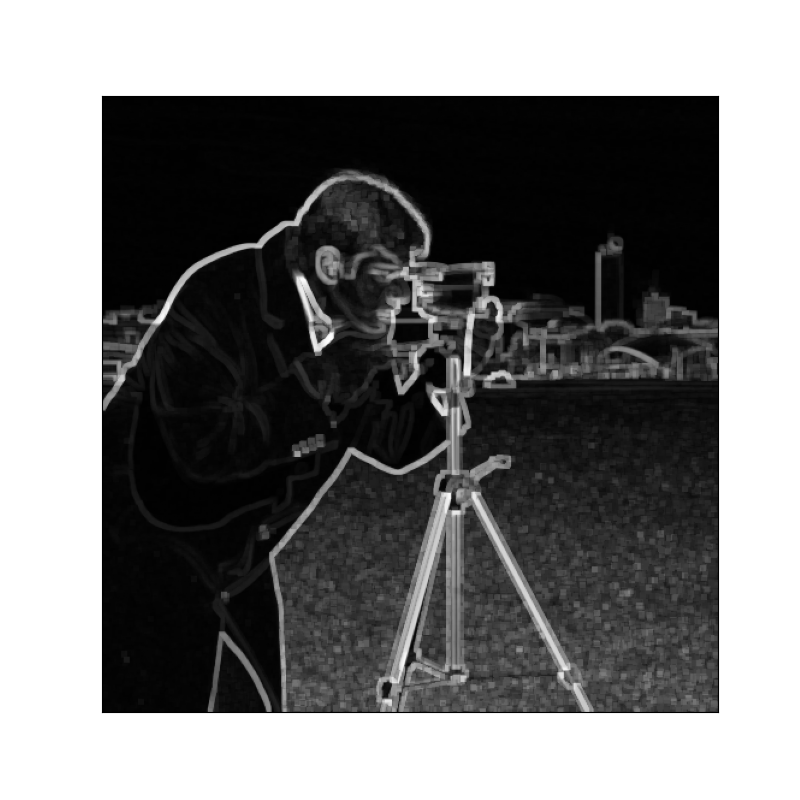
We compute the gradient
se = morpho.make_structuring_element_2d("disc", 2)
grad = morpho.gradient(img, se)

plt.figure(figsize=(8, 8))
plt.imshow(grad, cmap="gray")
plt.xticks([])
plt.yticks([])
plt.show()
Then, we compute the watershed on this gradient.
ws, nlabel = morpho.watershed(img, 8)
print(f"Number of label: {nlabel}")
Number of label: 13563
We finally illustrate the resulting segmentation
np.random.seed(0)
color = np.random.randint(low=0, high=255, size=(np.max(ws) + 1, 3))
color[0, :] = 0  # Watershed lines are illustrated in black
colorized = color[ws]

plt.figure(figsize=(8, 8))
plt.imshow(colorized)
plt.xticks([])
plt.yticks([])
plt.show()
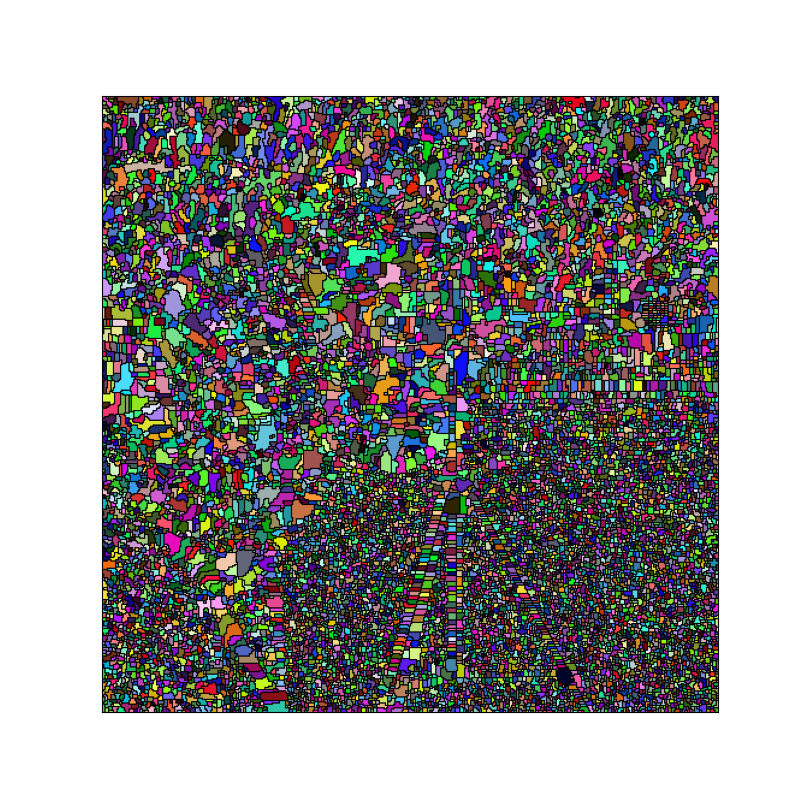
The disadvantage of the watershed from local minima is the fact it over-segments the image. To solve this issue, it may be useful to provide some markers from which the watershed will start the flooding
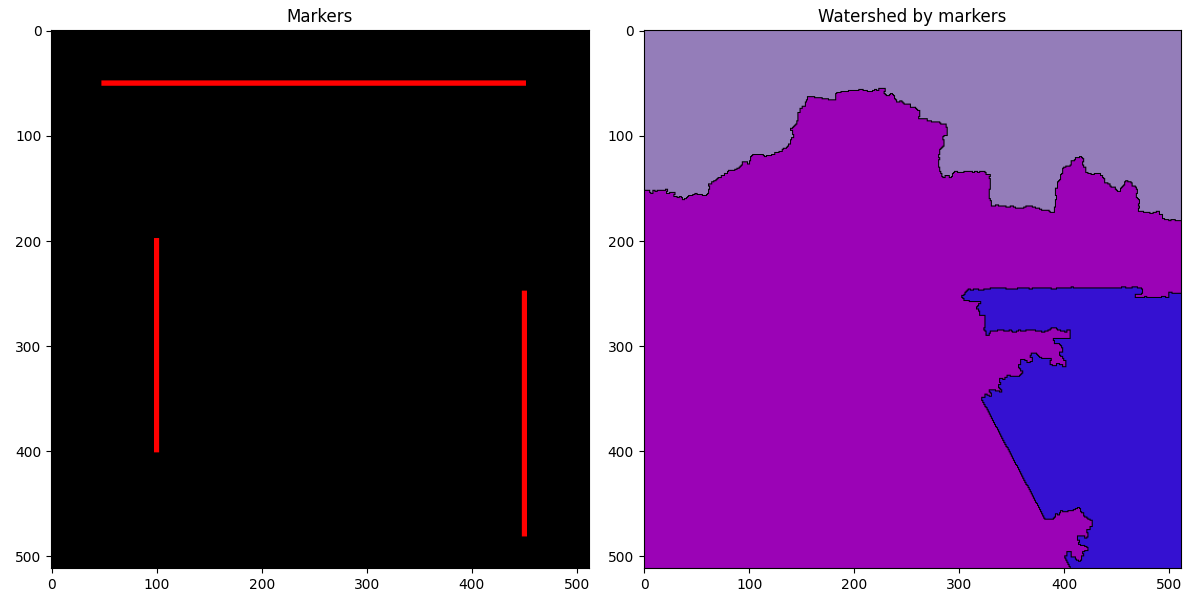
Watershed segmentation from user markers
First, we provide the input markers.
markers = np.zeros(img.shape, dtype=np.int16)
markers[200:400, 100] = 1
markers[250:480, 450] = 1
markers[50, 50:450] = 1
Then, we compute the watershed from markers.
ws2, nlabel2 = morpho.watershed(img, 8, markers=markers)
Finally we illustrate
color2 = np.random.randint(low=0, high=255, size=(np.max(ws2) + 1, 3))
color2[0, :] = 0  # Watershed lines are illustrated in black
colorized2 = color2[ws2]

markers = morpho.dilation(markers.astype(np.uint8), se)
markers_illustration = np.zeros((img.shape[0], img.shape[1], 3), dtype=np.uint8)
markers_illustration[markers > 0, 0] = 255

plt.figure(figsize=(12, 6))
plt.subplot(121)
plt.title("Markers")
plt.imshow(markers_illustration)
plt.subplot(122)
plt.title("Watershed by markers")
plt.imshow(colorized2)
plt.tight_layout()
plt.show()
Total running time of the script: (0 minutes 0.565 seconds)