Note
Go to the end to download the full example code.
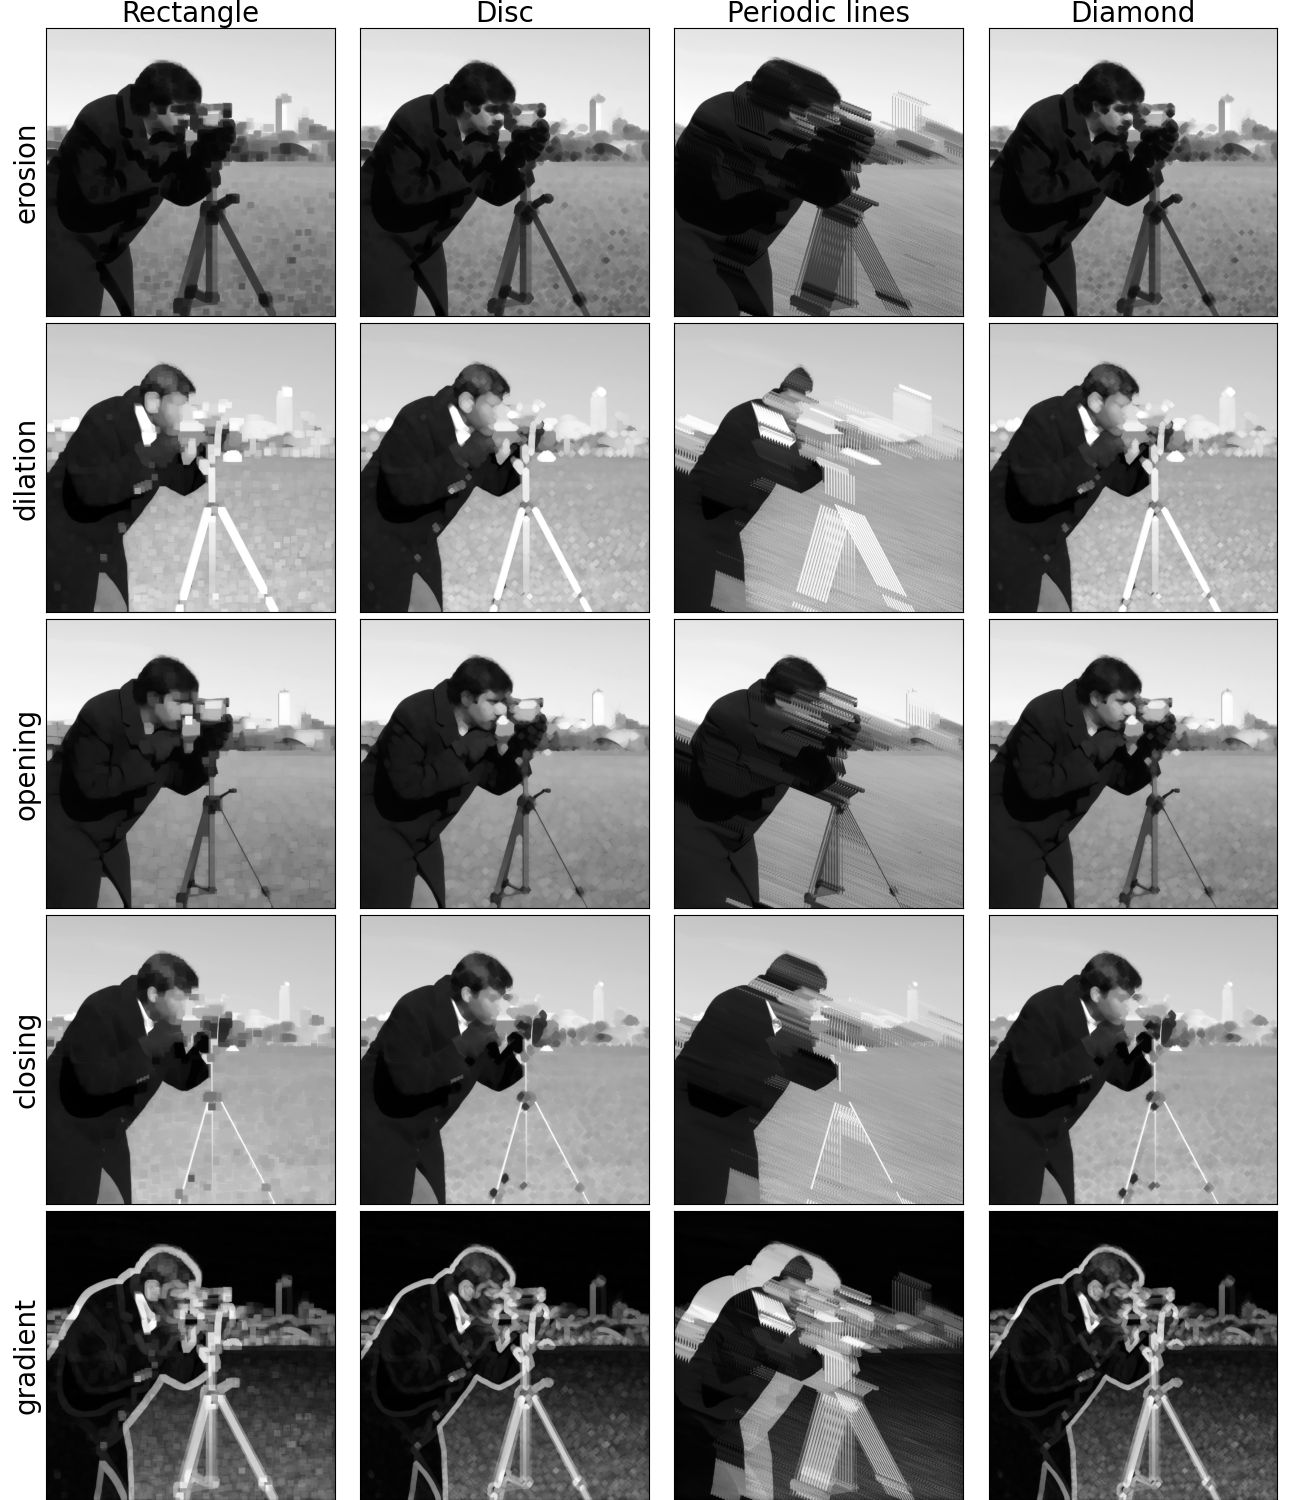
Structural morphological operations
This example shows how to use some structural morphological operations available in pylena.
Right now, five operations are available:
Erosion (
pylena.morpho.erosion())Dilation (
pylena.morpho.dilation())Opening (
pylena.morpho.opening())Closing (
pylena.morpho.closing())Gradient (
pylena.morpho.gradient())
Example
First, we import the different libraries needed for this example to run and we read the image.
import matplotlib.pyplot as plt
from skimage.morphology import diamond
from skimage.data import camera
import pylena as pln

img = camera()
Then, we define the structuring element used for the morphological operations. Four type of structuring element are available:
A 2D rectangle
A disc
Periodic lines
A mask, represented as a 2D NumPy array. This makes possible to use the scikit-image structuring elements.
To make it easier to use a predifined structuring element, the function
make_structuring_element_2d has been defined.
rect_se = pln.morpho.make_structuring_element_2d("rect", 10, 10)
disc_se = pln.morpho.make_structuring_element_2d("disc", 5)
pl_se = pln.morpho.make_structuring_element_2d("periodic_line", (5, 2), 5)
diamond_se = diamond(5)

operations = [
    pln.morpho.erosion,
    pln.morpho.dilation,
    pln.morpho.opening,
    pln.morpho.closing,
    pln.morpho.gradient,
]
Then, we use the morphological operations. They requires only two arguments: the input image, represented as a 2D NumPy arrays with a uint8 dtype, and the structuring element as explained above.
xtick_label = ["Rectangle", "Disc", "Periodic lines", "Diamond"]
ytick_label = ["erosion", "dilation", "opening", "closing", "gradient"]
fig, ax = plt.subplots(nrows=5, ncols=4, figsize=(13, 15))
for i in range(4):
    ax[0, i].set_xlabel(xtick_label[i], fontsize=20)
    ax[0, i].xaxis.set_label_position("top")
for i in range(5):
    op = operations[i]
    ax[i, 0].set_ylabel(ytick_label[i], fontsize=20)
    ax[i, 0].imshow(op(img, rect_se), cmap="gray")
    ax[i, 1].imshow(op(img, disc_se), cmap="gray")
    ax[i, 2].imshow(op(img, pl_se), cmap="gray")
    ax[i, 3].imshow(op(img, diamond_se), cmap="gray")

for a1 in ax:
    for a in a1:
        a.set_xticks([])
        a.set_yticks([])
plt.tight_layout(pad=0, h_pad=0.5)
plt.show()
Total running time of the script: (0 minutes 1.705 seconds)